
Wi-Fi operates at layer 1 (Physical) and 2 (Data Link) of the OSI model. All Wi-Fi devices that operate in both the 2.4GHz and 5GHz, and 6GHz in the future, must interoperate with other devices that use the same frequency. If you don’t already understand Clear Channel Assessment (CCA) and energy detect, check out my post on Wireless Contention Mechanisms! Spectrum Analysis is a topic that frequently comes up when discussing troubleshooting. Specifically, knowing the environment you’re working in, what the potential interferers are, which of those can be removed, and how to work around those that cannot.
This post covers the information that you will be expected to know for the CWNA-107 and CWAP-403 exams. The objectives below mention spectrum analysis or information that can be gathered by viewing layer 1 using a spectrum analyzer. The views I show will be from AirMagnet SpectrumXT as well as Ekahau Pro. Although the Wireless industry largely uses Ekahau over others, the graphics I was presented during my CWAP exam were not from Ekahau Pro. For the CWNA exam, the focus is on the concepts rather than identifying interferers.
CWNA-107 Objectives covered:
- 1.2 Apply the basic concepts of RF mathematics and measurement
- 1.2.4 Noise floor
- 1.2.5 SNR and SINR
- 6.2 Locate and identify sources of RF interference
- 6.2.2 Non-Wi-Fi devices
- 6.2.2.1 Airtime utilization
- 6.2.2.2 Frequencies used
- 6.2.3 Interference solutions
- 6.2.4 Spectrum analysis
- 6.2.2 Non-Wi-Fi devices
- 7.2 Describe and apply common troubleshooting tools used in WLANs
- 7.2.2 Spectrum analyzer
- 7.3 Identify and explain how to solve the following WLAN implementation challenges using features available in enterprise class WLAN equipment and troubleshooting tools
- 7.3.3 RF noise and noise floor
- 7.3.4 RF interference
CWAP-403 Objectives covered:
- 2.1 Capture RF spectrum data and understand the common views available in spectrum analyzers
- 2.1.1 Install, configure and use spectrum analysis software and hardware
- Configure Wi-Fi integration
- Save and export capture data
- 2.1.2 Capture RF spectrum data using handheld, laptop-based and infrastructure spectrum capture solutions
- 2.1.3 Understand and use spectrum analyzer views
- Real-time FFT
- Waterfall, swept spectrogram, density and historic views
- Utilization and duty cycle
- Detected devices
- WLAN integration views
- 2.1.1 Install, configure and use spectrum analysis software and hardware
- 2.2 Analyze spectrum captures to identify relevant RF information and issues
- 2.2.1 Determine the RF noise floor in an environment
- 2.2.2 Determine Signal-to-Noise Ratio (SNR) for a given signal
- 2.2.3 Locate and identify sources of RF interference
- 2.2.4 Identify RF channel utilization
- 2.2.5 Analyze a non-Wi-Fi transmitter and its impact on WLAN communications
- 2.2.6 Overlapping and non-overlapping adjacent channel interference
- 2.2.7 Poor performing or faulty radios
- 2.3 Analyze spectrum captures to identify various device signatures
- 2.3.1 Identify frequency hopping devices
- 2.3.2 Identify various 802.11 PHYs
- 802.11b
- 802.11g
- 802.11a
- 802.11n
- 802.11ac
- Channel widths
- Primary channel
- 2.3.3 Identify non-802.11 devices based on RF behaviors and signatures
- Microwave oven
- Video devices
- Jammers
- Cordless phones
- 2.4 Centralized spectrum analysis solutions
- 2.4.1 AP-based spectrum analysis
- 2.4.2 Sensor-based spectrum analysis
Capture Devices
There are multiple different spectrum analyzers on the market today. Some of the most common laptop-based are: Netscout Airmagnet Spectrum Adapter (previously Fluke Networks) used with Spectrum XT, Metageek’s Wi-Spy Spectrum Analyzer for use with Chanalyzer, and the Ekahau Sidekick for use with Ekahau Pro. Many APs are also starting to sport spectrum analysis through extra radios. For security, wireless sensors may also have spectrum analyzers built in to detect layer 1 anomalies. Each of these devices are typically sold as a package with the software required to run them. Some devices support an external directional radio to help with locating interferers. In cases where the device is omnidirectional, it is suggested you use the attenuation of your body to identify which direction the interferer is in.

Spectrum Analyzer Key Concepts
Spectrum analyzers are frequency domain tools used to measure amplitude in a finite frequency space. Wireless Engineers use spectrum analyzers to locate sources of interference that may have a negative impact on the 802.11 network as well as other protocols that operate in the same frequency, 2.4 or 5GHz. There are a few concepts to be familiar with that are used to describe spectrum analyzers.
Sweep Cycle – reading the energy across frequencies over a period of time, sometimes configurable by the user. Faster sweep times make finding interferers easier and allow you to better visualize modulations. Focusing on a channel makes finding interference sources faster by limiting the amount of frequency space being inspected.
Resolution Bandwidth (RBW) – a reference to the smallest frequency that can be resolved by the receiver. A high RBW is a narrower frequency, low is wider. The value used will directly impact the sweep time.
Frequency Bin – The FFT process creates frequency bins where the data is placed to create the FFT view. There are an evenly distributed number of “bins” that span the entire spectrum the analyzer operates in.
Spectrum Views
It is very important to understand what information can be understood from the different views for the CWAP exam. We’ll discuss each view below.
Real-Time Fast Fourier Transform (FFT)
FFT is an algorithm that samples a signal over a period of time or space divides it into its frequency components. The spectrum analyzer captures the RF energy within the time domain and converts the information to the frequency domain using the FFT process which is then viewable without gaps. I found this video from Tektronix very helpful for understanding this process of taking signals over time and viewing them across a frequency range. Below are some views from within Ekahau Pro and Airmagnet Spectrum XT of real-time FFT. They key words here are “real-time”; the information shown is live.


Swept Spectrogram
This is the same information as the real-time FFT but often in a different view and tracked over a longer period. These views can often be configured within software to specify the length of time. Spectrum XT shows the information over the course of the capture whereas Ekahau allows for a time selection from 1-120 seconds.

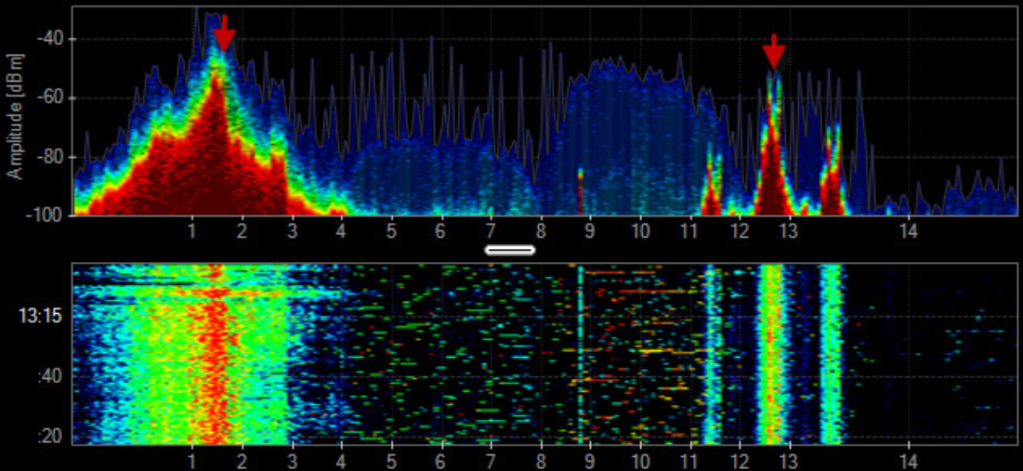
Waterfall View
The information from the swept spectrogram showing time, frequency, and power but viewed vertically.


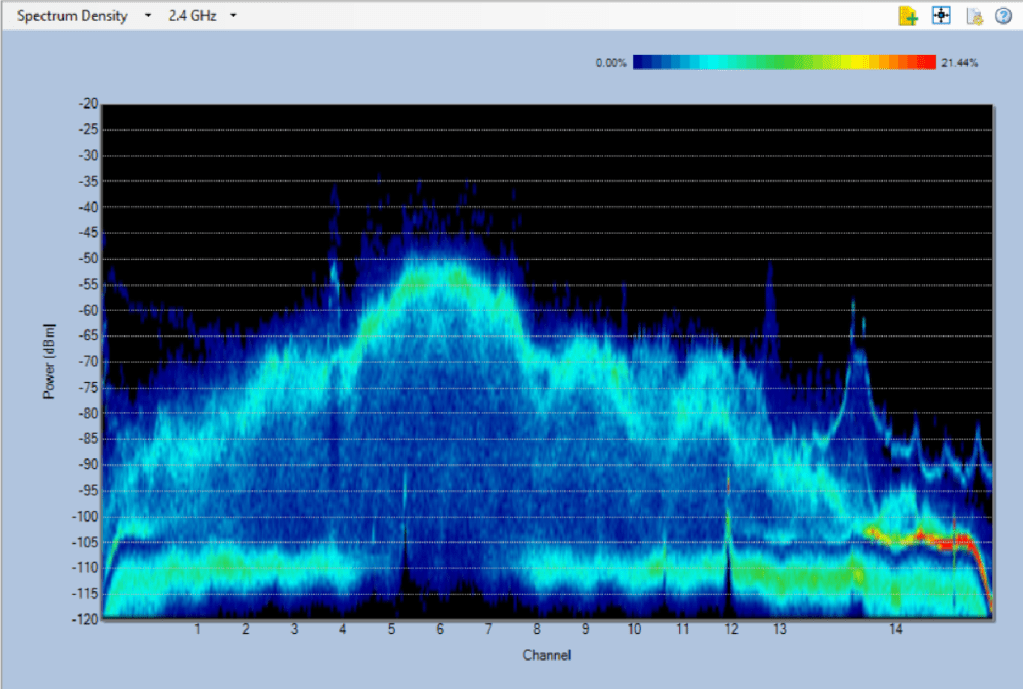
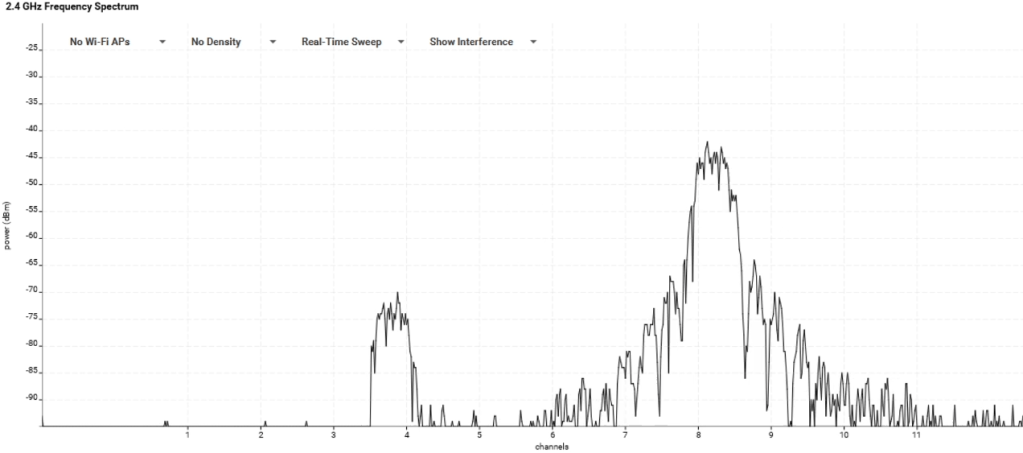
Power Spectral Density
Also referred to as spectrum density, it shows where detected RF energy variations are stronger and where variations are weaker. This is the primary view in Ekahau; you can add the real-time FFT average or max sweep to show overtop of the density view as well. Spectrum density views use colors to indicate the channel utilization. Ekahau uses green to represent low utilization and red/black to show high/very high utilization. Spectrum XT provides a legend.

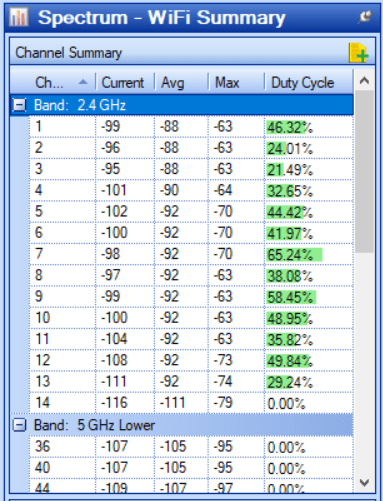
Channel Utilization and Duty Cycle
Channel utilization shows the percentage of time that the frequency is in use over a period of time. The software in use determines the threshold, some may use the noise floor where others may use a higher value. For example, Aruba documentation states “The spectrum analysis feature considers a frequency bin to be utilized if the detected power in that bin is at least 20 dB higher than the nominal noise floor on that channel.” This is a general measure of how busy the network is. Channel utilization measures both Wi-Fi and non-Wi-Fi devices. Duty cycle percentage is used to identify the amount of time a single device is active. Ekahau shows utilization percentages per channel in real time. Spectrum XT shows “Duty Cycle” percentage but doesn’t reference any single device; I believe this is channel utilization labeled as duty cycle.

SNR and Noise Floor
The amount of background energy, Wi-Fi and non, is the noise floor. It is always important to know the amount of noise in an area because wireless networks are designed around devices and applications. For example, Voice-grade wireless expects a signal-to-noise ratio (SNR) of 25dB. To calculate the SNR of a signal, we take the received signal strength indicator (RSSI) and noise floor value (-92dBm in the example below). The difference between these two values is the SNR. Each device has a unique receive sensitivity and will perceive the RSSI and noise floor differently than others. This results in newer devices, with higher receive sensitivity, being able to demodulate the same data rates at greater distances than older devices. Know that a large percentage of noise comes from access points and client devices. To fully understand what the noise floor is in a given area, you should survey or perform spectrum analysis during a time of normal usage.

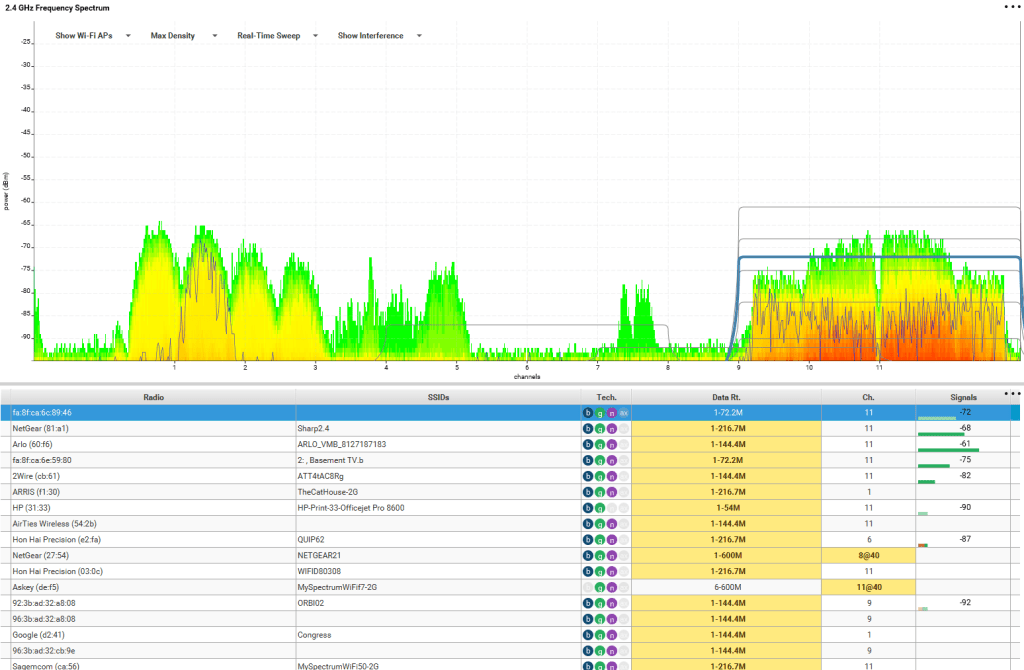
WLAN Integration
Spectrum analyzers show layer one information. It is frequently useful to view information from layer 2 within the same views. WLAN integration with spectrum analysis software enables this feature. The images below show the SSIDs and number of APs in Spectrum XT. We can also see detailed information in Ekahau about the APs, the SSIDs they broadcast, along with operating and capability information.

Adjacent Channel Interference
It is also important to understand the concept of adjacent channel interference (ACI); I describe this in my Wireless Contention Mechanisms post. The main point is that devices must perform physical carrier sense as part of the clear channel assessment process to check if the medium is busy or not. Nearby APs that operate on channels that overlap with the channel you use cause your clients to defer transmissions a lot more frequently. Your device will be able to decode frames sent on these overlapping channels because part of the frequency space is shared. After synchronizing with these transmissions, the device will perform virtual carrier sense by updating its NAV timer. If the channels were non-overlapping, 1, 6, or 11, the device would see the RF as noise and only defer as part of the physical carrier sense. The odds that this happens in a properly designed wireless network should be very low. Protocol analyzers can be used to identify this; they will show the channel the frame was transmitted on as well as which it was received on.

Identify the PHY
This sections covers how each 802.11 standard appears at layer 1, the physical layer, or “PHY”. Each 802.11 PHY has a different view in the wireless spectrum determined by the modulation in use. Inspecting spectrum density plots and real-time FFT views to pick out which PHY is in use is an expectation of the CWAP exam. Beacons are transmitted at the lowest mandatory data rate. Each data rate is achieved through a different type of digital modulation. When you’re viewing real-time FFT information, you are often seeing management and control frames sent at these lower data rate, using DSSS for example, and data frames sent using OFMD. I captured the views below by adjusting the lowest mandatory data rates on the Cisco WLC I have in my lab, reducing the target beacon transmission time (TBTT) to every 20 time units (TU) rather than the default of 100, and enabled broadcasting of 8 SSIDs.
802.11b – HR/DSSS
DSSS uses the very low data rate modulations including Amplitude / Phase Shift Keying (ASK/PSK). It can be identified by its mound shape. It spans 22MHz of frequency and uses barker 11 coding. Energy spreads from the center at 11MHz intervals. To avoid interference on other channels, the first side lobe is filtered down to 30dB below the center power and the second side lobe filtered to 50dB below. The real-time FFT view below shows the center frequency peaking at -30dbm and first side lobes at -60dBm.


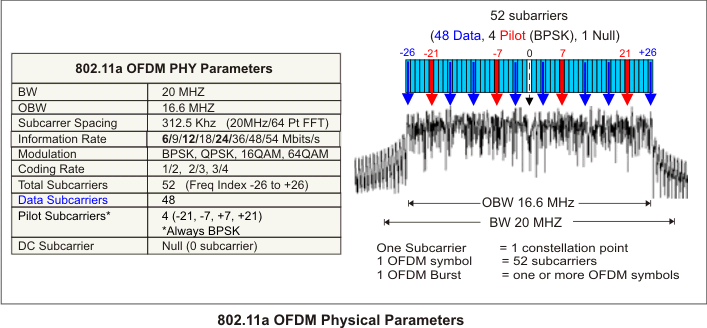
802.11a – OFDM
OFDM uses 20MHz wide channels containing 52 subcarriers; 4 for pilot and 48 for carrying data. The center contains one null subcarrier. Although the total occupied frequency space is 20MHz, only 16.6 MHz is occupied.

The image below explains OFDM components in detail.
802.11g – ERP-OFDM
802.11g brought OFDM to 2.4GHz. The views are the same as 802.11a.

802.11n/ac – HT/VHT
Identifying HT and VHT using spectrum analyzers is a matter of identifying bonded channels. Both standards use OFDM digital modulation. 802.11n introduced 40MHz wide channels and 802.11ac introduced 80 and 160MHz wide.
Bonded Channels
Identifying 40, 80, and 160MHz wide channels are easy; they appear as a wider 20MHz OFDM split on the center channel. With bonded channels, all management and control frames are sent on the primary channel which results in that channel being busier than others due to the required overhead to send 802.11 frames. Be sure you understand the number of subcarriers in use with OFDM when using 20 and 40 MHz wide channels.

Identify the Interferer
Recognizing patterns of different types of interferers is something that takes time to get used to. Thankfully, there are only a handful of patterns to remember in the real world and for the CWAP exam. Below we’ll review each interferer by type and take a look at their patterns.
Cordless Phone/Baby Monitor

Many Cordless phones baby monitors uses frequency hopping spread spectrum (FHSS) to communicate between the phone/camera and the base station. FHSS uses frequency shift keying (FSK) modulation and, in 2.4GHz, hops between different channels that range from 5-10MHz in width. FHSS jumps between its own channels (different frequencies than Wi-Fi channels) very rapidly. Cordless phones may dwell on a single channel while a call is taking place. FHSS is naturally resilient to eavesdropping and narrowband jamming. It also gives a sense of security due to the randomness and frequency of the “hops”. This FHSS spectrum is a great demonstration.

Wireless Camera

Cameras that operate in the 2.4GHz range follow a similar pattern. It is one of the patterns that I find most out in the wild but, given that I often survey indoors, never find them at a high amplitude. This interference examples from Metageek shows the patterns below.

Bluetooth
Bluetooth shares the 2.4GHz spectrum with Wi-Fi but uses 79 channels that are 1MHz wide, jumping frequencies 1500 times per second, and dynamically avoids nearby Wi-Fi networks using adaptive frequency hopping (AFH) in version 1.2 (11/2013). Bluetooth comes in many different use cases; it is often very low power and does not cause problems for Wi-Fi devices.


Microwaves

Microwaves are wideband interferers, they cover the entire 2.4GHz spectrum and follow a very loose “form”. The suggestions for Wi-Fi around microwaves include replacing ones that cause excess interference and/or change to 5GHz in the break/kitchen area.

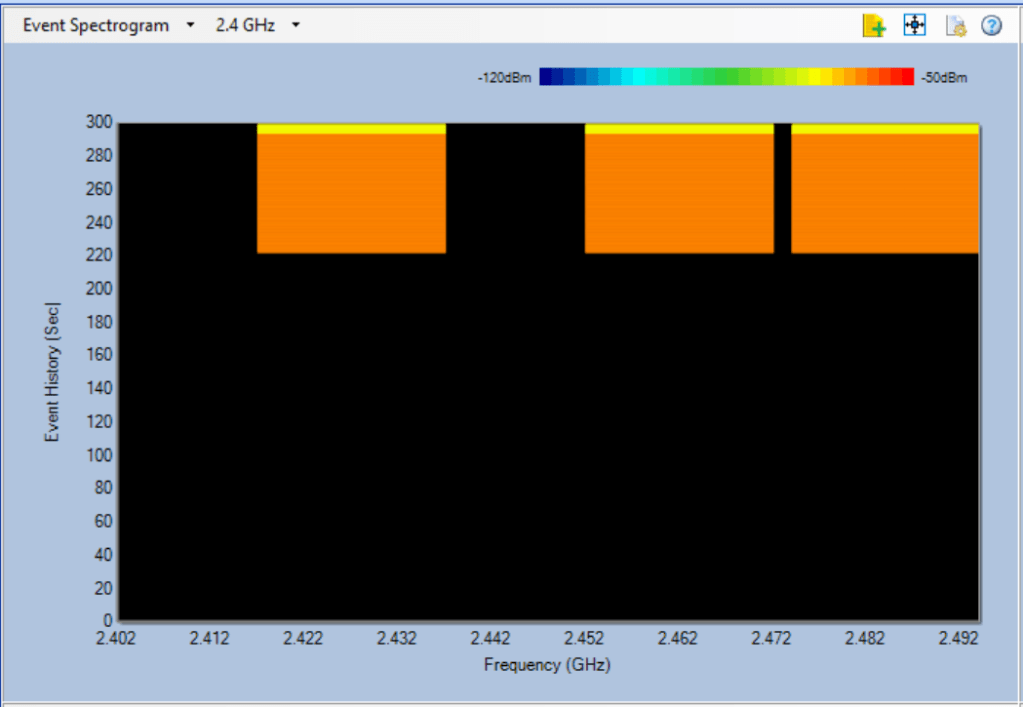
Jammers
RF jammers are wideband and increase the channel utilization to 100%, making Wi-Fi unusable. Physical carrier sense energy detect will result in busy causing the device to defer transmissions. The graphic below shows a jammer operating in the 2.4GHz range. Jammer visualization below from Jussi Kiviniemi during an Ekahau webinar.
Automatic Device Detection
Spectrum analysis software typically has a signature database that it uses to help the user identify the type of device based on the way it operates within the given spectrum. The image below shows Ekahau identifying my baby monitor as a video camera. Spectrum XT also had the ability to detect patterns and provide them in a list. By viewing the Event Spectrogram view, you could see the affected channels over time along with signal strength seen at.


Faulty Devices
The spectrum view of a faulty device will vary. Although this is fairly open-ended, the CWAP book mentions that faulty devices are “chatty” and can be found sending frames that result in collisions and reduce the throughput of the wireless network.
Use Cases
For the exams, and in the real world, it’s important to know when to use a spectrum analyzer. As mentioned earlier, spectrum analyzers gather layer 1 information (plus some extra with WLAN integration) while protocol analyzers capture layer 2 (and above when decrypting frames). Use spectrum analyzers to identify sources of interference, physically locate them, and remove them if possible. In cases where the interference is the byproduct to the primary function of a device that is required by the business, you will have to make adjustments to the interferer and/or wireless network.
Physical adjustments:
- Shield the noise
- Physically move the interferer
- Replace the device with non-offending ones (such as old “leaky” microwaves)
Wireless network adjustments:
- Change channels
- Change frequency bands from 2.4 to 5GHz
- Increase transmit power to overcome the interferer
- Use directional antennas to focus RF towards the clients and increase receive sensitivity at the AP
A real-world example is the use of an overhead crane to move things that are large/heavy and operate using an electric motor. When the crane is in use, it completely jams the 2.4GHz spectrum. Hand scanners used at ground level connected via 2.4GHz lose SSH connectivity to the application server. The solution in this case is to, if the scanners support it, change to 5GHz only.
Conclusion
Although it may be fun to play ghost busters from time to time, 95% of the time I have found that the interference is a necessary evil that must be worked around. This includes the overhead crane example as well as offices in cities with surrounding consumer grade Wi-Fi routers/devices, X-Ray devices in healthcare, forklifts with electric motors, and more! The industry shift from Spectrum XT to Ekahau, primarily how fast the spectrum analyzer can sweep the spectrum has been huge. Similar to scanning multiple channels with a single adapter for the purpose of protocol analysis, spectrum analyzers sweeping the spectrum at a slow speed results in gaps of information, making the job harder. Although it may be hard to view the real-time FFT information for fast-moving frequency hopping devices such as Bluetooth, the more information you are able to gather, the better.
As part of my survey process, I review the gathered spectrum analysis information that my Ekahau Sidekick automatically collects and report anything that would impact the wireless network. Measuring the impact can be difficult from time-to-time but using the channel utilization information, and knowing the best practice of <50%, it is simple to understand areas that are impacted and discuss with customers, managers, or impacted users.
I hope these graphics assist in identifying each type of PHY as well as the common sources of interference! Thanks for reading.
References
Chanalyzer + Wi-Spy User Guide
Metageek – Wi-Fi and non-Wi-Fi interference
Aruba – Customizing Spectrum Analysis Graphs
Datto Networking: Which WiFi channels should I use?
802.11 Wireless Networks: The Definitive Guide, 2nd Edition
Keysight – 802.11 OFDM Overview

Just found a reference to your blog on the official CWAP-404 Study Guide.
Great stuff!
LikeLiked by 1 person
I’m preparing for my CWAP and your blog is fantastic !
LikeLike